
What is Practice Firmographics?
Practice firmographics are the business characteristics of a healthcare practice, including practice size, number of providers, annual revenue, ownership structure, location type, and specialty mix.
Updated September 2026
Practice Firmographics Explained
Just as company firmographics describe a business (industry, revenue, employee count), practice firmographics describe a healthcare practice's business profile. This data goes beyond individual provider information to characterize the practice as an organization: how many clinicians work there, who owns it, roughly what it bills in a year, and how many locations it operates.
The distinction from provider-level data is worth spelling out. A provider record answers questions about one clinician: name, NPI, specialty, license state. A firmographic record answers questions about the business that clinician works inside. B2B sales teams selling software, devices, or services to practices buy on the second set of answers, because budget and buying process live at the practice level, and a rep who only has provider records ends up calling five clinicians at the same group without knowing they share one decision-maker.
What fields count as practice firmographics?
Most vendors carry some subset of the fields below. Coverage and accuracy vary widely by field:
| Field | What it tells you | Typical source |
|---|---|---|
| Provider count | How many clinicians practice at the location, a proxy for size and budget | NPI registry records grouped by address |
| Location count | Single office vs multi-site group | NPI address grouping, business listings, the practice website |
| Ownership type | Independent, DSO or MSO-owned, hospital-affiliated, private equity-backed | State business registries, press releases, website footers |
| Estimated revenue | Rough annual billing, modeled rather than reported | Provider count x specialty billing averages, commercial estimates |
| Years in operation | Established practice vs new opening | NPI enumeration date, state registration filings |
| Specialty mix | What the practice treats, and whether it's single or multi-specialty | specialty classifications on associated NPIs |
| Technology stack | Which EHR, practice management, and billing systems run the office | Website scanning, patient portal analysis |
The last row is technically its own category (technographics), but most buyers evaluate it alongside firmographics because the two get used together in the same segmentation pass. Our technology detection entry covers how those fields get built.
Where does the data come from?
No single registry publishes practice firmographics, so the data is assembled. The CMS NPPES registry supplies the raw material for provider counts and specialty mix: group every individual NPI that shares a practice address or a Type 2 organizational NPI, and you have a defensible size estimate. State business registries add ownership entities and filing dates. Commercial databases model revenue. Website scans supply the technology layer and often confirm location counts that registry data gets wrong.
Assembly quality is where vendors separate. NPI records go stale because providers rarely update their addresses after moving, so a vendor that groups raw NPPES addresses without verification will count providers at offices they left three years ago. Ask any healthcare firmographic data provider two questions: how provider counts are grouped into practices, and when each record was last verified against a source other than NPPES. The healthcare data vendor comparison covers how the major vendors answer.
How do sales teams segment with firmographics?
Practice firmographics exist for one job: deciding which accounts get which sales motion, before anyone dials. A solo dental practice billing around $500K needs different products and has a different budget than a 15-provider DSO-owned group generating $8M a year. Without firmographic fields, both look like one row in a spreadsheet with a dental specialty classifications.
The standard pattern is a three-way split. Accounts below a size floor get dropped or routed to a low-touch motion, because a practice too small to afford the product costs the same call time as one that can. The mid-market band gets the core outbound motion. The large end, usually multi-site groups and PE-backed rollups, gets named-account treatment, since one DSO decision can cover 40 locations. Ownership type matters as much as size here: selling into a DSO-owned office means selling to the DSO's corporate team, and reps who pitch the office manager at a corporate-owned location waste the call. Healthcare SaaS teams lean on this split hardest because their pricing tiers usually map directly to provider count.
Payer mix earns its place in the field list for a narrower set of sellers. A revenue cycle vendor built for Medicare billing wants practices heavy on Medicare volume. A cash-pay aesthetics product wants the opposite. Neither can see that from a name and address file.
How accurate are firmographic fields?
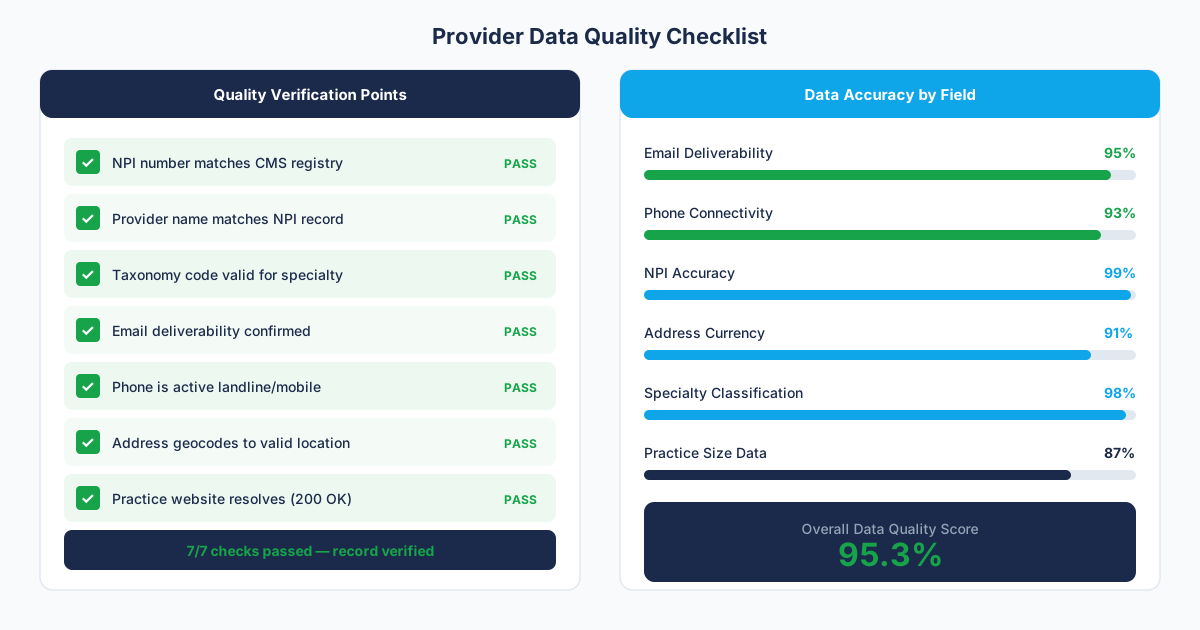
Accuracy splits by how directly a field can be observed. Provider counts built from grouped, verified NPI records are strong. Location counts confirmed against the practice website are strong. Ownership is middling, since acquisitions outrun public records and many DSO-owned offices keep their original branding. Revenue is the weakest field on the list: private practices don't publish financials, so every revenue figure is a model output, usually provider count multiplied by specialty billing averages with a geographic adjustment. Treat revenue as a banding tool (under $1M, $1-5M, over $5M) rather than a number to quote back to a prospect.
The practical test when evaluating a vendor: pull ten practices you already know and check the fields you can verify yourself. If provider counts and ownership hold up on accounts where you know the truth, the file earns some trust on the accounts where you don't.
Why Practice Firmographics Matters for Healthcare Data
Firmographic data turns provider lists from flat name-and-address files into segmentable sales databases. You can prioritize high-revenue practices, filter out solo providers who can't afford enterprise pricing, and target specific ownership types that match your ideal customer profile.
Real-World Example
A practice management software company segments their target list of 40,000 dental practices by firmographics: 28,000 are solo or 2-provider practices (too small for their enterprise product), 8,000 are mid-size groups of 3-10 providers (their sweet spot), and 4,000 are large DSO-owned groups (handled by enterprise sales). This segmentation lets them assign the right sales motion to each tier.
Frequently Asked Questions
Where does practice firmographic data come from?
Firmographic data is compiled from multiple sources: NPPES (provider counts per location), state business registries (ownership structures), commercial databases (revenue estimates), web scraping (technology stack, website data), and public filings. No single source has complete firmographics.
What practice firmographic fields are most useful for sales?
The three most impactful fields are practice size (number of providers), estimated revenue, and ownership type. These three fields let you filter out accounts that are too small, too large, or the wrong ownership structure for your product.
How accurate are practice revenue estimates?
Revenue estimates for private healthcare practices are approximate since private practices don't publish financials. Estimates are typically modeled from provider count, specialty billing averages, and geographic cost indices. Expect accuracy within a range rather than precise figures, and use revenue as a banding filter instead of a talking point.
What is the difference between firmographics and demographics in healthcare data?
Demographics describe the individual provider: age, gender, education, specialty, years in practice. Firmographics describe the practice as a business: size, ownership, revenue, locations. Sales teams targeting practices buy firmographics; recruiting and pharma teams targeting individual clinicians care more about demographics.
How do healthcare firmographic data providers build provider counts?
Most group individual NPI records that share a practice address or a Type 2 organizational NPI. The method is sound, but raw NPPES addresses go stale when providers move without updating their records, so counts are only as good as the vendor's verification layer. Ask when records were last checked against a source other than NPPES.
Can you filter a provider list by practice ownership type?
Yes, if the file carries an ownership field. Independent, DSO or MSO-owned, hospital-affiliated, and PE-backed are the usual values. Ownership data lags reality because acquisitions outrun public records, so expect some corporate-owned locations to still show as independent, especially recent rollups that kept their original branding.
Sources and References
Related Resources
Get the Provider Data You Need
Tell us what you're looking for. We'll build a custom list matched to your target market.
Trusted by healthcare sales teams, medical device companies, and health IT vendors across the US.